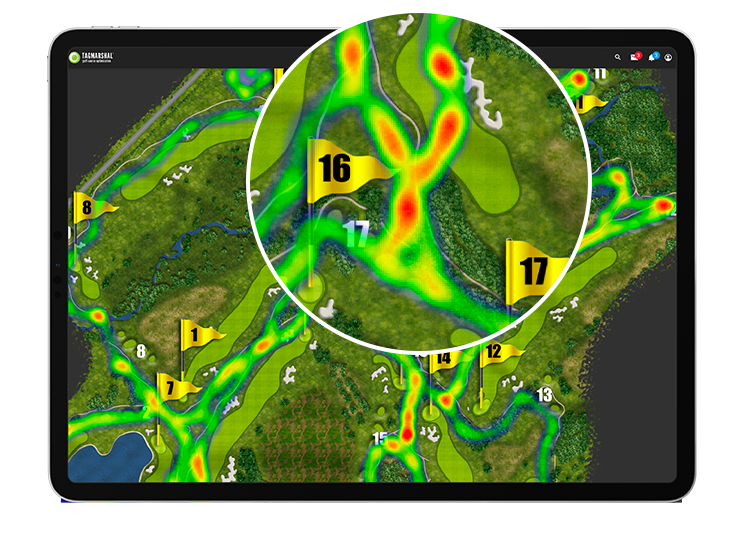
Heatmap Visualization
As groups move around the course, GPS tracking records their paths. The heatmap technology works by entering a course utilization time frame, which then depicts all collected geolocation data by carts and walkers that the system has tracked.
Using this technology, superintendents have an aerial course view of mow patterns and the movement of maintenance teams and machinery, which is extremely useful in identifying areas where operational efficiencies are possible.
SPOT YOUR HIGH-TRAFFIC AREAS

With usage heatmaps overlaid on top of each other at the end of a day or week, areas that are receiving high traffic become clearly visible.

This data touches on a number of areas where improvements and tweaks can be made to enhance the player experience, such as course setup and cart path policing.
Visible wear patterns reveal areas with the most traffic, which are the most at risk of soil compaction.

The heatmaps also help with identifying areas where extra irrigation or fertilizer may be required, aiding sustainability efforts and minimizing costs where possible.
SOLUTIONS
 WATCH DEMO

